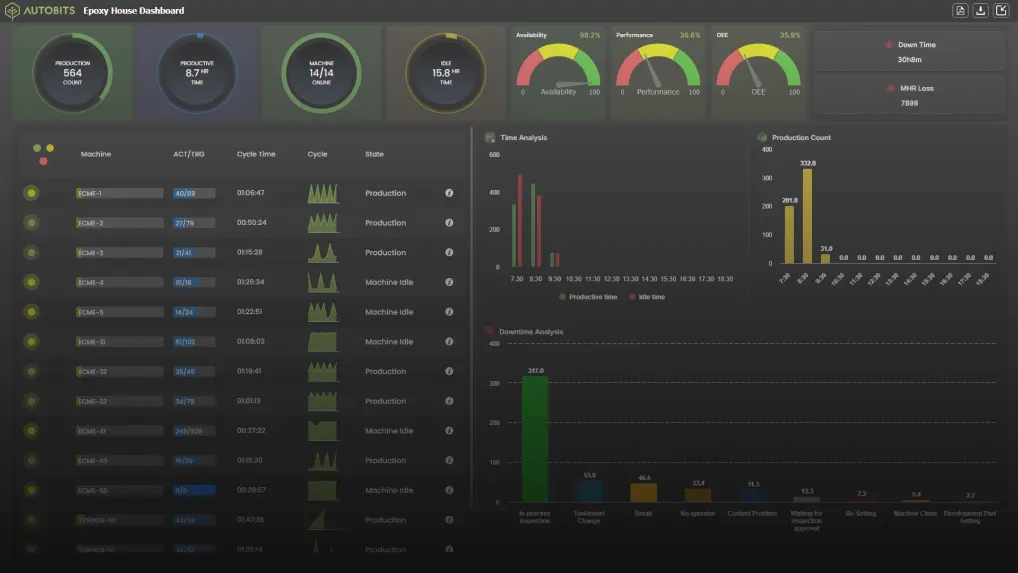
Your OEE optimization approach must include a method for measuring downtime, rejections, and cycle times 24/7. OEE, or Overall Equipment Effectiveness, is a fantastic idea that informs you how much waste is on your shop floor in a single number. It’s just the ratio of what you actually produced to what you could have produced — the actual output to theoretical maximum capacity. It’s a straightforward indicator of your profitability and return on investment. Increased OEE leads to increased profitability.
Availability: The percentage of planned running time available for production is known as availability. Unplanned and planned downtime fall under this type of losses.
Unplanned downtime occurs when equipment is scheduled to operate but is unable to do so due to unplanned circumstances. Equipment breakdowns, unplanned maintenance, a shortage of operators or resources etc.
Planned downtime occurs when equipment is set for production but is unable to do so due to planned circumstances. Changeover, tooling adjustment, cleaning, scheduled maintenance, and quality inspection are just a few examples.
Performance: The ratio of the number of components produced to the theoretical maximum number of components that might have been produced in the period the machine was running. Inspection, insert changes, tool breakage, and other factors might create a difference between the start and end of a cycle.
Quality: The percentage of components that pass quality inspection compared to the total number of components produced. The number of components rejected is the difference. On the shop floor, OEE allows you to measure and reduce waste. It’s a single number that everyone understands, from the machine operator to the President. It may be tracked and improved on month to month.
Example:
- Available time in a day = 20 hours (short feast breaks and shift changes)
- Running time = 15 hours (5 hours lost because of breakdowns, setup change)
- Theoretical production=220 parts
- Actual production=200
- Parts Good production=180
- Availability= 15/20 = 75
- Performance= 200/220 = 9
- Quality=180/200=9
- OEE = A x P x Q = 0.75 x 0.9 x 0.9 = 61
This figure indicates that only 61% of the available capacity is being utilized, with the remaining 39% being wasted. That’s terrible, but it’s a lot better than the usual shop floor. In terms of return on investment, 61% OEE is equivalent to paying for a banana and receiving just 3/5 of it.
You can’t improve your OEE unless you measure and track it, as well as its components A, P, and Q, on a regular basis. Your OEE optimization approach must include a Machine Monitoring System that tracks Production, Machine Downtime, and Rejections automatically.


