
Imagine this situation. You install CNC machine monitoring software in your factory, connect a few machines, and expect real-time dashboards to start showing accurate production data. Instead, you see incorrect cycle times, machines appearing offline, unstable network behaviour, and operators questioning the numbers. This happens more often than manufacturers admit. The root cause is not the software; it is the lack of understanding of key technical terms and concepts that directly impact installation and accuracy.
Modern machine monitoring systems depend on clear definitions, correct configuration, and proper interpretation of data. When manufacturers understand these fundamentals before installation, the project becomes faster, cheaper, and far more reliable.
In this comprehensive guide, you will learn:
- The exact meaning of CNC machine monitoring and how it works in real environments
- The technical terms that every manufacturer must understand before installation
- Machine-level concepts that influence data accuracy
- Connectivity and network requirements that impact system stability
- Software, data, and compliance concepts that ensure long-term success
By the end of this guide, you will know precisely what to prepare before installation and how to avoid common mistakes. Let us begin with the core concept of CNC machine monitoring.
Quick Answer or TLDR
Before installing CNC machine monitoring software in your factory, you must clearly understand how data flows from your machines, how connectivity works on the shop floor, and what technical terms influence accuracy. Successful implementation depends on preparing your machines, networks, and teams with the right knowledge before any hardware or software is deployed.
Key points you must know:
- CNC monitoring works by collecting signals from controllers, sensors, and PLCs, then converting them into usable production data
- Understanding terms like cycle time, machine states, spindle signals, feed hold, and MTBF is essential for accuracy.
- Stable network connectivity is critical because even 1 to 2 per cent packet loss can cause missing data.
- Data formats, sampling intervals, and machine protocol compatibility directly affect the results you see
- Misunderstanding these basics leads to incorrect dashboards, wrong OEE, and poor decision-making.
This guide explains each of these concepts in simple, practical language.
What CNC Machine Monitoring Actually Means
CNC machine monitoring is the process of collecting real-time data from machines, converting that data into usable information, and presenting it in a way that helps manufacturers make faster and more accurate decisions. It is not just a dashboard or a set of sensors. It is a complete data flow system that starts at the machine controller and ends at the decision maker.
Most manufacturers think monitoring only means seeing the current state of a machine. In reality, true monitoring covers five major data layers.
Machine Signals and Controller Data
CNC controllers like Fanuc, Siemens, Mitsubishi, and Haas generate hundreds of internal parameters. Monitoring software reads selected parameters that represent the actual condition of the machine.
Examples include:
- Cycle start and cycle stop signals
- Feed hold and program hold
- Spindle load and spindle speed
- Axis alarms and tool change signals
- Program number and part count
If the wrong parameters are selected, the monitoring system cannot calculate accurate cycle time or utilisation.
Sensor Inputs and Digital Signals
Older machines or machines without protocol support rely on external sensors.
Examples include:
- Current sensors to detect spindle motor activity
- Vibration sensors to identify abnormal machine behaviour
- Digital input sensors to capture on or off states
Correct sensor placement is critical. A sensor placed on the wrong cable or panel can completely confuse the system.
Data Capture and Conversion
Once the signals are collected, the system converts them into a standard data format. This process includes:
- Filtering noise
- Removing duplicate signals
- Sampling data every 1 to 5 seconds
- Converting raw pulses into meaningful metrics
Incorrect sampling intervals often lead to missing events or inflated cycle times.
Real-Time Processing and Calculation
The software calculates machine states based on rules.
For example:
- If the spindle load is above a threshold, the machine is considered in cutting mode
- If the cycle start is triggered but the spindle load is zero, the machine is in idle
- If alarms persist for more than 10 seconds, the machine enters an alarm state
These rules differ for each machine type and operation, which is why configuration is important.
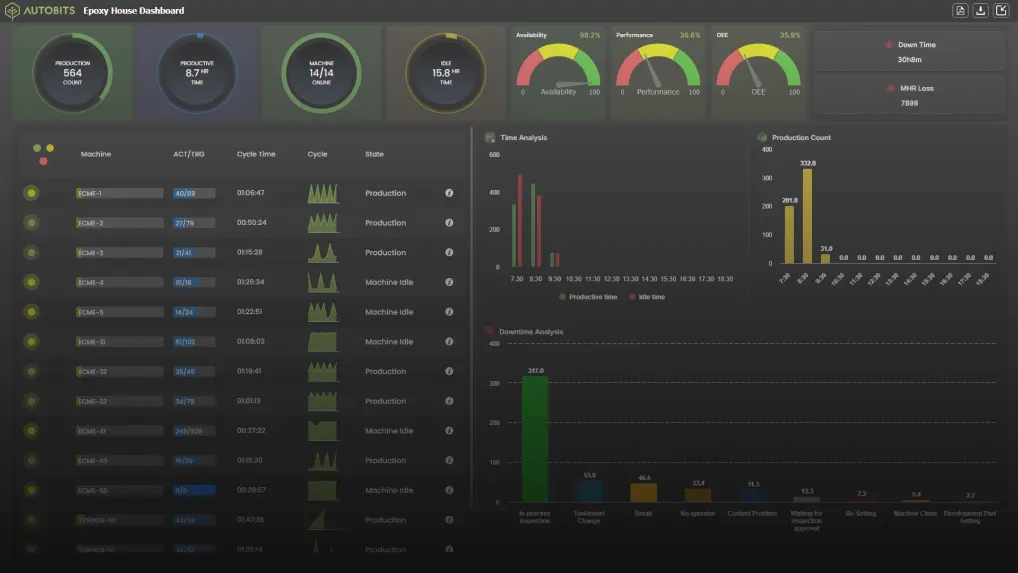
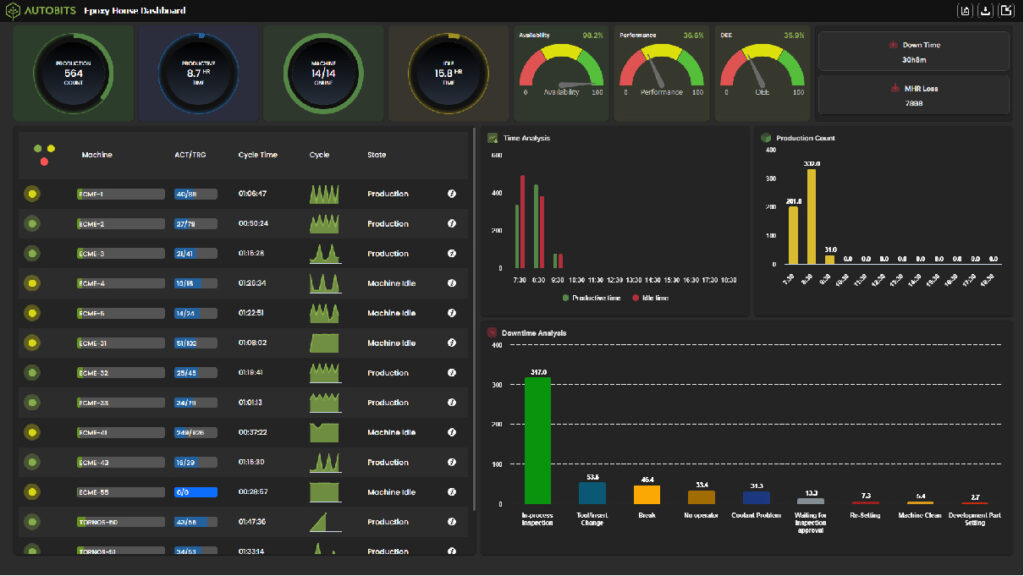
Visualisation and Production Insights
The final layer is the output you see.
Examples include:
- Live machine status
- OEE and utilisation
- Part count accuracy
- Cycle time comparison
- Downtime categorization
Monitoring only works if the previous layers are correct. Wrong inputs lead to wrong outputs.
Key Technical Terms You Must Know
Before installing CNC machine monitoring software in your factory, you must understand a set of technical terms that directly influence accuracy, reporting, and integration. These terms appear in every monitoring system, but their meaning is often misunderstood. Incorrect interpretation leads to incorrect data, wrong decisions, and failed implementations. This section explains each term clearly with real factory examples.
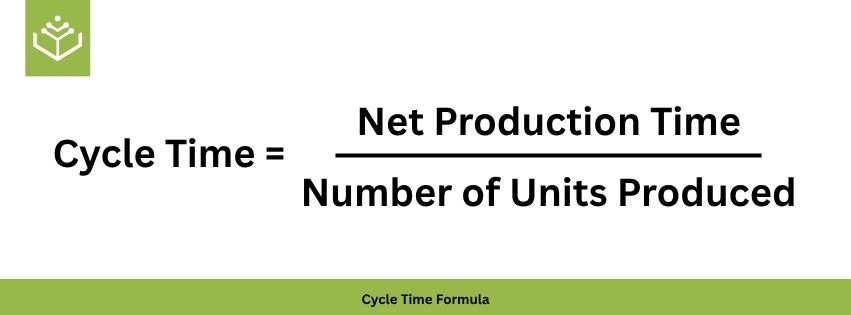
Cycle Time
- Cycle time is the total time a machine takes to complete one full machining cycle.
- It includes tool movement, material cutting, rapid moves, and return to the home position.
- If your machine has internal delays or operators pause the program, the cycle time becomes inflated.
- Accurate monitoring requires identifying true cutting time versus idle motion.
Example: A machine shows an 85-second cycle time manually, but 92 seconds in monitoring. The extra 7 seconds often come from micro pauses in spindle load or dwell operations.
Machine States
Every monitoring system uses machine states to categorise activity.
Common states include:
- Running
- Idle
- Stopped
- Alarm
- Setup
- Tool change
These states are calculated using signals like cycle start, feed hold, spindle load, and alarm codes.
If your machine sends multiple overlapping signals, incorrect states may appear.
Spindle Load
- Spindle load indicates how much force the spindle is applying during cutting.
- It helps differentiate between active cutting and idle running.
- A threshold is set, usually between 10 and 15 per cent, for most operations.
Example: If the spindle load stays below the threshold, the system marks the machine as idle even if the spindle is turning.
Feed Hold
- Feed hold indicates that the operator paused the cycle without stopping the machine program.
- The spindle may still be rotating, but material removal stops.
- Monitoring tools must differentiate between normal cycles and intentional pauses, or else the cycle time appears longer.
MTBF (Mean Time Between Failures)
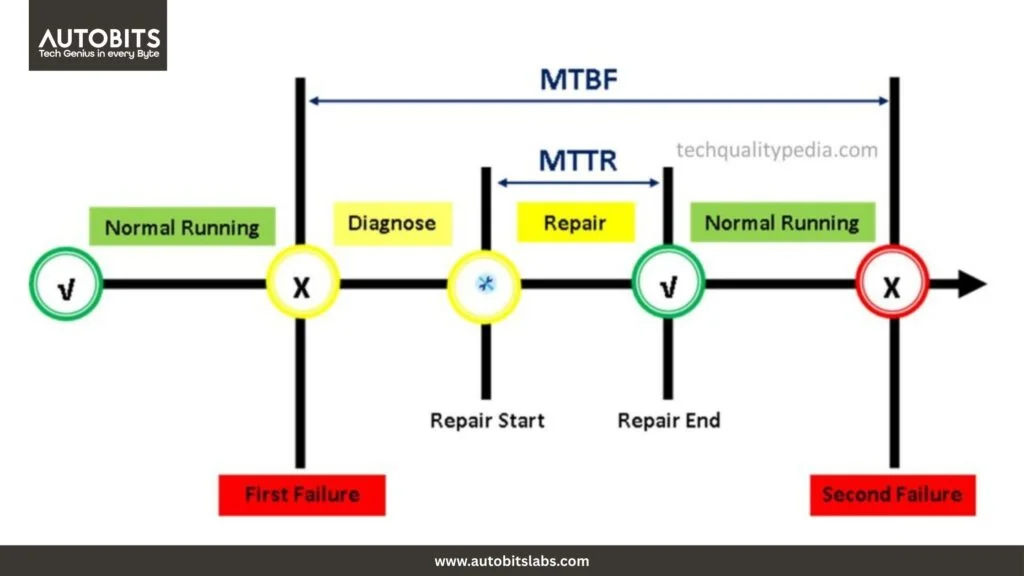
- MTBF represents the average time between breakdowns of a machine.
- Monitoring systems use failure codes or alarm logs to calculate this metric.
- Lower MTBF often indicates maintenance issues, overheating, or spindle wear.
MTTR (Mean Time to Repair)
- MTTR measures how long your team takes to fix a breakdown.
- It includes technician response time, diagnosis duration, and actual repair time.
- Monitoring software uses downtime logs to calculate it.
- A high MTTR usually means poor maintenance processes or a lack of spare parts.
Part Count Logic
- Part count is not always a physical counter.
- Depending on machine type, it may be read from PLC counters, program end signals, or external sensors.
- Incorrect configuration causes inflated part counts or missing counts.
Alarm Codes
- Each controller generates alarm codes with unique numbers.
- These codes help identify tool failures, limit switch errors, spindle overload, and program issues.
- Monitoring systems must map these codes correctly to show meaningful downtime reasons.
Understanding these terms gives you the foundation needed for accurate CNC machine monitoring.
Machine-Level Terms Manufacturers Should Understand
Machine-level concepts determine how accurately a monitoring system interprets the behaviour of each CNC machine on your shop floor. Two machines from the same brand can behave differently because of controller versions, macros, wiring, operational methods, or operator habits. Understanding these terms helps you prepare machines correctly before installation.
Machine Interlocks
Interlocks are safety and operational conditions that must be satisfied before a machine can run.
Examples include:
- Door interlock
- Coolant interlock
- Lubrication interlock
- Safety relay interlock
If any interlock is active, the machine will not run. Monitoring software reads these signals to identify safe or unsafe machine states. A loose door switch can cause false stops that appear as downtime.
M Codes and G Codes Behaviour
Monitoring systems rely heavily on understanding how your shop uses M codes and G codes.
For example:
- M30 resets the machine at the end of a cycle
- M00 is a program stop
- M01 is an optional stop
- G04 creates dwell delays
If operators frequently add M00 or M01 in programs, your monitoring system may detect longer idle times or unexpected pauses. Understanding your code strategy helps configure accurate state logic.
Tool Change Logic
Tool changes can happen automatically using ATC systems or manually, depending on machine type.
Monitoring software must differentiate:
- Tool change time
- Setup time
- Idle time between tools
- Failed tool change alarms
Real-world example:
A shop in Rajkot reported 140 an average tool change time. After configuration, the system revealed that 48 seconds were due to operators cleaning chips manually. Once corrected, the tool change time dropped to 75 seconds.
Rapid Movements versus Cutting Movements
Machines often move rapidly between positions without cutting material.
Monitoring must capture:
- Rapid traverse
- Feed rate-controlled cuts
- Air cuts
- Non-cutting moves like probing
If rapid moves are misinterpreted as cutting, utilisation appears inflated.
Coolant and Lubrication Status
Monitoring coolant and lubrication signals helps identify early warning signs of machine wear.
Low coolant levels often cause thermal expansion issues.
Poor lubrication can reduce spindle and ball screw life.
Monitoring systems use these signals to issue preventive maintenance alerts.
Program Number and Program Path
Every machining cycle runs a specific program.
Monitoring software reads the active program number to:
- Track parts produced by each program
- Compare cycle times for different variants
- Identify programming issues
If programs are nested or subprograms are used, the monitoring team must map them correctly.
Physical Machine Wiring
Older CNC machines often require tapping into physical wiring to capture signals like cycle start, parts count pulses, or spindle run. Poor wiring, loose terminals, or incorrect polarity result in inconsistent data.
Understanding your wiring diagram helps ensure clean signal capture.
When you understand these machine-level concepts, installation becomes smoother and the system delivers accurate insights.

Network and Connectivity Terms Explained
CNC machine monitoring depends heavily on the reliability of your factory network. Even if your machines are perfectly configured, poor connectivity creates missing data, slow dashboards, and incorrect utilisation reports. Many monitoring projects fail not because of the software but because the network layer was not understood or prepared. This section explains the essential connectivity terms every manufacturer must know before installation.
Ethernet Connectivity
Most modern CNC controllers support Ethernet-based data communication.
Examples include:
- Fanuc FOCAS Ethernet
- Siemens OPC UA
- Haas Ethernet interface
- Mitsubishi SLMP
The quality of the Ethernet connection directly affects the quality of the data. A loose RJ45 connector or an old unmanaged switch often causes intermittent disconnections that affect real-time monitoring.
Important: A single packet drop every 50 to 60 seconds can cause gaps in machine states or missing part counts.
IP Address and Subnet
Each CNC machine must have a unique IP address.
A common issue on shop floors is duplicated IPs, where two machines are accidentally assigned the same address. This creates conflict and makes machines appear online and offline repeatedly.
Builders often set default subnet ranges like 192.168.0.x.
Monitoring teams must verify this during installation.
Network Switches
Factories often use a mix of old and new network switches.
Monitoring requires stable and industrial-friendly switches, ideally with the following characteristics:
- Gigabit speed
- Metal enclosure
- Surge protection
- Managed configuration for priority traffic
Unmanaged switches work but can cause inconsistent latency during peak hours.
WiFi versus Wired Connection
A wired connection is always preferred for CNC machines because it offers:
- Lower packet loss
- Stable speed
- Zero interference
Many factories request WiFi due to distance or space limitations. Although possible, WiFi increases the chance of data delays and disconnections. If WiFi must be used, industrial access points and strong signal strength are mandatory.
Firewall and Port Rules
Some CNC controllers require specific ports to be opened on the firewall for communication.
For example:
- Fanuc uses port 8193
- OPC UA uses configurable ports
- Legacy machines may use port-based data forwarding
If ports are blocked, the machine will not communicate with the monitoring system.
VPN and Remote Access
Many factories want remote dashboards. For this, a secure VPN connection is needed.
Monitoring teams must avoid open port forwarding because it increases cybersecurity risks.
A VPN ensures encrypted communication between the factory and cloud servers.
Data Transfer Rate
Monitoring usually requires small packets sent every 1 to 5 seconds.
If multiple machines share a slow network segment, updates may lag.
A minimum of 100 Mbps per switch segment is recommended for stable performance.
Understanding these network and connectivity fundamentals helps avoid delays, rework, and incorrect data during installation.
Software and Data Terms Simplified
CNC machine monitoring systems depend on how well the software interprets machine data. Even if the hardware and network are perfect, a poor understanding of software and data concepts leads to inaccurate dashboards, wrong OEE, and unreliable decision-making. This section breaks down software terms in simple language with practical factory scenarios.
Data Sampling Interval
This is the frequency at which the monitoring system reads data from the machine.
Most systems capture data every 1 to 5 seconds.
- A 1-second interval shows precise transitions between running, idle, and alarm
- A 5-second interval may miss micro stops or feed hold pauses
If your operation involves many short-cycle jobs, a high sampling interval can lead to incorrect part counts or inflated cycle times.
Example:
A shop running 14-second cycle jobs missed 12 to 15 per cent of actual cycles because their sampling was set to 5 seconds.
Data Tags or Parameters
These are specific data points extracted from the CNC controller or PLC.
Examples include:
- Spindle speed
- Spindle load
- Feed override
- Program number
- Axis position
- Servo alarms
Monitoring systems map these tags to generate machine states and metrics.
Choosing the wrong tag or misunderstanding tag behaviour results in incorrect calculations.
Data Normalization
Every controller reports data in a different format.
For example, spindle load might be reported as a percentage by one brand but as raw voltage by another.
Normalisation converts these varied formats into a standard structure that the monitoring software can understand.
If normalisation is not done correctly, thresholds and state detection become inaccurate.
Edge Processing
Edge processing means processing data directly at the machine or on a local gateway device before sending it to the cloud.
This reduces delays, improves reliability, and reduces internet bandwidth usage.
Factories with poor internet stability benefit from edge processing because data is not lost during temporary outages.
Data Retention
This defines how long your factory data is stored.
Most systems offer:
- Short-term retention in real-time dashboards
- Long-term retention in historical analytics
Factories must plan for long-term retention because maintenance, costing, and industrial engineering teams often need 6 to 12 months of data.
Duplicate Signal Filtering
Machines sometimes send duplicate signals due to wiring noise or controller behaviour.
Monitoring software removes these duplicates to maintain accuracy.
Example:
A machine that sends cycle start twice within 100 milliseconds may inflate part counts unless duplicates are filtered.
API and Integrations
APIs allow monitoring software to connect with ERP, MES, or maintenance tools.
Manufacturers should understand:
- What data will be shared
- How often will the data sync
- How integrations impact reporting workflows
Proper integration planning prevents data mismatch between software systems.
Understanding these software terms prepares your team for accurate configuration and smooth implementation.
Compliance and Security Terms You Cannot Ignore
CNC machine monitoring is not only about connecting machines and collecting data. It also involves compliance, cybersecurity, and safety obligations that many manufacturers overlook. Ignoring these terms can expose your factory to operational risks, data loss, or unauthorised access. This section explains the essential compliance and security concepts in simple language with real factory scenarios.
Data Privacy and Access Control
Every monitoring system stores sensitive production data such as cycle time, machine utilisation, and downtime patterns.
Access control defines who can see what information.
Factories should set:
- Operator-level viewing rights
- Supervisor-level rights with downtime editing
- Management-level access for analytics
- Admin access for configuration
Granting unnecessary access often leads to data manipulation or unapproved editing of downtime reasons.
Encryption
Encryption protects data while it moves across the network or the internet.
Two types matter:
- Encryption during data transmission
- Encryption during data storage
If encryption is not enabled, a local network breach can expose your production information or maintenance logs.
Example:
A manufacturer in Pune experienced data leakage when an unsecured switch allowed third-party devices to access monitoring traffic.
Firewall Rules
Firewalls control which devices can communicate with your monitoring server.
Incorrect firewall rules cause:
- Machines are going offline unexpectedly
- Delayed updates
- Failed data synchronisation
Correct firewall rules ensure only authorised systems exchange data with the monitoring platform.
Audit Logs
Audit logs keep a detailed record of:
- User logins
- Downtime edits
- Configuration changes
- Data exports
These logs ensure transparency and help identify errors or misuse.
Factories that do not maintain audit logs often face disputes when investigating production discrepancies.
Compliance with Industrial Standards
Monitoring systems should follow common industrial communication and security standards.
Examples include:
- OPC UA security
- ISO 27001 for data management
- Secure PLC communication practices
- Controller-specific guidelines, such as Fanuc FOCAS protocol compliance
Understanding these standards helps ensure the system integrates safely with your CNC controllers.
Backup and Disaster Recovery
Monitoring systems store a large amount of historical data that supports maintenance, costing, and forecasting.
A proper backup plan must include:
- Daily automatic cloud backups
- Local edge device backups
- Recovery plan in case of server failure
Without backups, a server crash can erase months of operational insights.
User Authentication Standards
Strong user authentication protects your dashboards from unauthorised access.
Factories should use:
- Strong passwords
- Role-based access
- Two-factor authentication is available
Weak login practices are one of the most common causes of factory data breaches.
Understanding these security and compliance terms ensures your CNC monitoring project is reliable, safe, and aligned with modern industrial practices.
Why CNC Machine Monitoring Matters Today
Modern manufacturing has moved far beyond manual supervision and reactive maintenance. Today, factories demand speed, precision, reliability, and data-backed decisions. In this environment, CNC Machine Monitoring is no longer a “nice-to-have” tool. It has become a core operational requirement.
Here’s why it matters more than ever:
Rising Pressure on Productivity
Manufacturers are expected to produce more, faster, and with fewer errors. But traditional monitoring methods cannot keep up with:
- High machine utilisation demands
- Complex production schedules
- Thin margins that leave no room for inefficiency
Machine monitoring helps teams understand actual performance, bottlenecks, and hidden downtime in real time.
Increasing Cost of Downtime
Every minute of CNC downtime costs money; sometimes thousands per hour, depending on the production line.
Common problems like:
- Operator delays
- Unplanned stoppages
- Program mismatches
- Tool breakage
Often go unnoticed until they impact output. Monitoring exposes these losses instantly, allowing quicker action.
Skilled Labour Shortages
Factories today struggle to find enough skilled operators and supervisors. With fewer people managing more machines, human-dependent monitoring is not scalable.
A monitoring system acts like an always-on digital supervisor, reducing dependency on manual tracking.
Growing Need for Traceability
Customers and regulatory bodies increasingly demand transparency around:
- Production time
- Quality controls
- Machine conditions
- Process consistency
Machine monitoring automatically records this data, making audits and customer reporting significantly easier.
Demand for Data-Driven Decisions
Manufacturing leaders want to answer questions like:
- Which machines perform the best?
- What causes the most downtime?
- Are we meeting planned targets?
- Where do we lose productivity?
Without monitoring, most answers rely on assumptions or incomplete logs. With monitoring, decisions become objective and measurable.
Competitive Advantage
Factories using CNC Machine Monitoring consistently outperform those that don’t. Benefits include:
- Higher OEE
- Lower operational costs
- Better delivery timelines
- Improved operator accountability
- More predictable planning
In competitive markets, these improvements directly impact profits and customer satisfaction.
Common Misconceptions About CNC Machine Monitoring
Before implementing CNC Machine Monitoring, many manufacturers carry assumptions that lead to confusion or wrong expectations. Clearing these misconceptions is essential because they directly affect how smoothly the adoption happens.
“Monitoring is only for large factories.”
Many believe that only large-scale plants need monitoring.
In reality, even a 5–10 machine shop benefits significantly because:
- Smaller teams struggle with manual tracking
- Every minute of downtime impacts revenue
- Better visibility reduces dependency on a single operator
Monitoring is scalable for all factory sizes, not just big ones.
“Operators will feel controlled.”
It is not about policing operators. It is about understanding machine behaviour.
In well-managed factories, monitoring actually reduces operator stress because:
- They do not need to record data manually
- System-generated reports prove their effort
- Issues become visible to management without blame games
Monitoring brings fairness and transparency, not surveillance.
“It’s expensive and complicated to set up.”
Modern systems are:
- Plug and play
- Affordable even for small workshops
- Quick to install (many go live in hours)
- Easy to scale
Most manufacturers overestimate the complexity. The actual process is straightforward when done with a proper plan.
“We already track everything manually. Why do we need software?”
Manual tracking captures only what operators remember to write and usually misses:
- Micro downtime
- Delay between tool changes
- Operator-to-operator variation
- Program-level details
- Real-time stoppage reasons
Software tracks 100 per cent of machine activity objectively and instantly.
“My machines are old, so that monitoring won’t work.”
This is one of the most common myths.
Even old CNC machines without Ethernet ports can be monitored using:
- Electrical signal mapping
- Sensor-based monitoring
- Retrofit communication modules
Age does not limit monitoring capability.
“Monitoring will fix the machine.”
Monitoring does not repair machines.
It helps you identify what needs to be fixed, such as:
- Tool wear
- Excess load
- Inconsistent cycle times
- Unusual stoppage patterns
It is a decision support system, not a maintenance tool.
“OEE will automatically increase once monitoring is installed.”
Monitoring gives transparency, not improvement by itself.
Real performance gains happen when:
- Data is analysed
- Losses are acted upon
- Operators follow SOPs
- Managers use the insights
- Teams commit to continuous improvement
Monitoring provides the truth. Improvement comes from action.
Key Terms Every Manufacturer Should Know Before Installation
Before installing CNC Machine Monitoring Software, it is important to understand a few essential terms. These concepts help manufacturers interpret machine data correctly, make better decisions, and ensure a smooth implementation. Knowing these terms in advance also reduces confusion during training and system setup.
Uptime
Uptime is the total duration when the machine is actually running and producing parts.
It helps answer questions like:
- How many hours was the machine productive
- How much of the planned shift was utilised
- Which machines perform best in real operations
Higher uptime directly contributes to higher output.
Downtime
Downtime is any period when the machine is stopped, regardless of the reason.
It includes:
- Tool changes
- Setup time
- Material shortage
- Operator breaks
- Unplanned stoppages
- Machine alarms
Monitoring helps you classify downtime so that improvement actions can be fact-based.
Planned and Unplanned Stoppages
Planned stoppages include expected activities like setup, inspection, warm-up, tool change and cleaning.
Unplanned stoppages occur due to unexpected events like breakdown, operator delay, program errors or tool failure.
Understanding this difference is crucial for accurate reporting and avoiding wrong assumptions.
Cycle Time
Cycle time is the time taken by the machine to complete one part from start to finish.
Monitoring helps identify:
- Deviations in cycle time
- Operator impact
- Tool wear
- Inconsistencies across shifts
Optimising cycle time leads to higher throughput.
Part Count
Part count is the total number of components produced by the machine in a given period.
Accurate part counting is important for:
- Productivity calculations
- Meeting delivery deadlines
- Ensuring quality consistency
- Evaluating machine performance
Manual part counting often contains errors, which monitoring eliminates.
Machine Utilisation
Machine utilisation measures the percentage of time a machine is performing productive work compared to the total available time.
It helps you determine:
- Overall efficiency
- Capacity planning
- Load balancing
Utilisation directly affects cost and profitability.
OEE (Overall Equipment Effectiveness)
OEE is the most popular productivity metric in manufacturing.
It is calculated based on:
- Availability
- Performance
- Quality
Monitoring systems calculate OEE in real time, helping you see the exact reasons for low performance.
Spindle Load
Spindle load indicates how much load the spindle is taking during machining. High or fluctuating spindle load can indicate tool wear or cutting issues.
Monitoring spindle load helps in:
- Predictive maintenance
- Preventing tool breakage
- Ensuring consistent machining quality
Alarms and Error Codes
These are the machine’s internal signals that indicate issues.
Understanding alarm patterns helps in reducing breakdowns and planning maintenance intelligently.
MTBF and MTTR
MTBF means Mean Time Between Failures.
MTTR means Mean Time To Repair.
These metrics show how reliable your machine is and how quickly issues are resolved.
Knowing them helps teams improve maintenance planning and reduce unexpected downtime.

Technical Requirements Before You Begin
Before installing CNC Machine Monitoring Software in your factory, it is important to ensure that your machines, network, and data collection environment are technically ready. The success of the entire project depends on these foundational checks. When these areas are not evaluated properly, manufacturers often face inaccurate data, unstable connectivity, or incomplete reporting.
Below is a clear, practical breakdown of the technical requirements you must validate.
Machine Compatibility
Not every CNC machine supports monitoring in the same way. Some machines provide direct data output, while others require adapters or retrofitting.
Consider the following:
- Machine brand and model
- Controller type such as Fanuc, Mitsubishi, Siemens, Haas or Fagor
- Available communication protocols such as MTConnect, OPC UA, Ethernet, and RS232
- Availability of ports like LAN, USB or Serial
Real example:
A manufacturer with a mix of older Fanuc 0i models and new Siemens 828Ds needed RS232 converters for older machines and direct Ethernet connections for newer models. Understanding this early helped reduce installation delays by 40 per cent.
Controller Data Access
Different controllers provide different levels of data access.
Some allow real-time extraction of spindle load, feed rate, program number, part count and alarm codes. Others may restrict certain parameters.
Before starting, check:
- Does the controller allow external data reading
- Does the OEM lock any parameters
- Is OEM support required for unlocking channels
- Does the controller need a software license to enable data output
If this is not clarified, the monitoring software may appear inaccurate even though the issue lies in the controller settings.
Electrical and Signal Layout
Your monitoring hardware needs stable power and clean signal lines.
Checklist:
- Adequate power supply for IoT devices
- Grounding quality
- Noise-free electrical environment
- Proper cable routing away from high interference areas
- No broken or loose signal cables
Factories with high welding activity or heavy motors often experience noise interference. Shielded cables or converters resolve this issue.
Network Availability
Monitoring systems rely on stable connectivity.
Minimum requirements:
- Strong LAN connection inside the shop floor
- Fixed IPs for machines or gateways
- Firewall permissions for data flow
- WiFi coverage only if cables are not possible, although a wired connection is preferred
- Router capacity for multiple simultaneous connections
If data packets drop frequently, your real-time dashboard will show inconsistent uptime or downtime.
IT and Cybersecurity Alignment
Machine data needs to be handled safely.
Your IT team must validate:
- Compliance with internal cybersecurity policies
- Permission for outbound or inbound data flow
- Secure communication protocols such as SSL encryption
- Whether monitoring will be on-premise or cloud
If cloud is selected, data transfer needs to be tested during peak network load.
Sensor and Additional Hardware Needs
Some machines do not produce digital signals. In such cases, additional sensors are required.
Examples of required hardware:
- Current sensors for spindle detection
- Proximity sensors for door or cycle start signals
- IoT gateways to transmit data
- Power monitoring meters for energy analysis
Accurate sensor selection ensures that manual intervention is not needed.
Data Accuracy Expectations
Before installation, be clear on what type of data you expect.
For example:
- Do you want part count accuracy of 99 per cent
- Do you want exact cycle time reporting
- Do you want machine-level alarms or minimal signals
- Will operator input be part of the reporting
This alignment avoids confusion after deployment.
Software Infrastructure
Your software environment must support:
- Dashboard access for multiple users
- Role-based login
- Integration with ERP or production planning tools
- Data storage capacity for 6 to 24 months
- High-resolution screens for shop floor displays
This ensures your team can review and act on data easily.
Machine-Level Terms Manufacturers Should Understand
Understanding machine-level terms helps you interpret data correctly once the Machine Monitoring Software is installed. These terms describe how the machine behaves on the shop floor and what signals the monitoring system can capture. Correct understanding avoids confusion during configuration, shift reporting, or troubleshooting.
Axis Movements
CNC machines move along axes such as X, Y, Z, A, B, or C.
Monitoring uses these signals to detect machine activity.
What you need to know:
- Continuous axis movement indicates active machining
- Idle axes with the spindle running may point to improper programming
- Abnormal axis vibrations can show wear or loose fixtures
For example, during a heavy milling job on a VMC, frequent Z-axis variation might indicate a worn tool or incorrect height offset.
Spindle Speed
Spindle speed is measured in RPM and refers to how fast the spindle rotates.
Monitoring compares the programmed RPM with the actual RPM.
Why it matters:
- Deviations indicate cutting load variations
- Incorrect RPM can cause tool breakages
- High fluctuation may indicate lubrication issues
Feed Rate
Feed rate is the speed at which the tool moves across the part.
Monitoring software uses feed rate data to detect real machining.
Examples:
- Low feed rate for long durations indicates the operator is slowing down to avoid tool failures.
- Sudden increases can damage the tool or part.
- An incorrect feed rate in a program results in an inconsistent cycle time
Servo Load
Servo load shows the load on each axis motor.
It helps detect friction, wear, and misalignment.
High servo load can indicate:
- Dry ways
- Damaged ball screws
- Tight fixtures
- Incorrect offset

Spindle Override and Feed Override
Operators often adjust overrides during machining.
Monitoring systems record these values.
If override changes are made frequently, it means the program is unstable or operator-dependent.
Program Number and Block Number
CNC machines run programs such as O1234 or P5678.
Monitoring identifies:
- Which program is running
- Whether the wrong programs are loaded
- Where the program paused
This is important for quality consistency.
Alarm Status
Alarms are errors generated by the machine.
Monitoring logs alarm codes such as 100, 414, 907, or 1020.
This helps identify:
- Repeat issues
- Preventive maintenance opportunities
- Operator training needs
Machine State
Machine monitoring identifies states such as:
- Running
- Idle
- Stopped
- Alarm
- Setup mode
Accurate state detection ensures correct OEE calculation.
Network and Connectivity Terms Explained
Connectivity is the backbone of CNC machine monitoring. Understanding these terms ensures stable data flow between machines, gateways, and the monitoring platform.
MTConnect
MTConnect is an open protocol used for CNC data transfer.
It provides standard data tags like spindle speed, feed rate, program number, and status.
Machines that support MTConnect offer easier and faster implementation.
OPC UA
OPC UA is a machine communication standard used in industrial automation.
It is secure and supports complex data.
Used widely in Siemens and high-end controllers.
Ethernet Communication
Ethernet is the most stable method of connectivity.
Advantages:
- High speed
- Low data loss
- Suitable for real-time dashboards
Most modern CNCs support Ethernet ports.
RS232 Serial Communication
Older machines use RS232 ports.
Data transfer is slower but reliable.
Ideal for machines with Fanuc 0i series or older Mitsubishi controllers.
IP Addressing
Fixed IP addresses ensure the monitoring device always identifies the machine.
Problems from incorrect IPs include:
- Data mismatch
- Duplicate machine logs
- Dashboard errors
Firewalls and Ports
Your IT team must open specific ports for data flow.
If ports are blocked, the machine will show intermittent connectivity.
Data Packet Loss
Packet loss means some machine data is not reaching the server.
If packet loss exceeds 5 per cent, real-time OEE becomes inaccurate.
Software and Data Terms Simplified
Understanding software-level terms helps manufacturers interpret dashboards and reports effectively.
Real Time Dashboard
Shows live machine status such as running, idle, stopped, or alarm.
Helps supervisors make immediate decisions.
Historical Reports
These include shift reports, hourly production logs, and downtime trend analysis.
Used for audits and review meetings.
Data Sampling Rate
Sampling rate is the frequency at which data is captured.
For example, 1 1-second sampling means the system records the status every second.
Higher sampling rate increases accuracy.
Data Normalization
Different machines give data in different formats.
Normalisation ensures consistent interpretation across all machines.
Edge Device or Gateway
A gateway converts machine signals into readable digital data.
Used when machines do not support protocols like MTConnect.
Role-Based Access Control
Users see dashboards based on their role, such as operator, manager, or admin.
This improves data security and clarity.
API Integration
APIs are used to integrate monitoring systems with ERP or MES.
Examples:
- Auto pushing part count to ERP
- Syncing shift rosters
- Integrating downtime codes
Compliance and Security Terms You Cannot Ignore
Data Encryption
All communication should be encrypted using SSL to prevent unauthorised access.
Audit Logs
The system must record who made changes, when they were made, and what was changed.
This is required for ISO audits.
IT Security Policy Compliance
Your monitoring solution must align with:
- Corporate IT guidelines
- Firewall rules
- Cloud storage policies
Data Retention Policy
- Define how long you want to store machine data.
- Most manufacturers store data for 6 to 12 months.
Access Permissions
Only authorised users should access sensitive data such as production efficiency or downtime reasons.
On-Premise vs Cloud
- On-premises means data stays inside your factory.
- Cloud means you can access dashboards from anywhere.
What Wrong Understanding Leads To
An incorrect understanding before installation causes many operational issues:
- Incorrect OEE values
- Misclassification of downtime
- Operators blame the software instead of the training gaps
- Poor decision-making due to an inaccurate part count
- Wrong expectations, such as expecting quality data from a machine that does not provide it
- Delayed installation because network readiness was not checked
- Confusion among operators, supervisors, and IT teams
A major manufacturer in Rajkot lost 22 per cent of its productive time for two weeks because it assumed all their machines had Ethernet ports. Half of them required RS232 converters.
Helpful Resources Before Installation
Manufacturers should refer to the following:
- Controller manuals for data access features
- MTConnect and OPC UA documentation
- Internal IT policy documents
- Previous breakdown logs
- Tool life reports
- Power quality records
- Network layout diagrams
- Sample shift reports
These resources help set correct expectations and ensure smooth onboarding.
How Autobits Labs Simplifies These Challenges
In our experience working with hundreds of machines across India, we have found that smooth implementation depends on clarity in machine capability, network stability, and data expectations. Autobits Labs simplifies this with a structured approach that reduces installation time and eliminates guesswork.
We begin with a detailed machine assessment that identifies controller type, communication protocol, available ports, and required sensors. This helps avoid unexpected hardware purchases. Our gateway devices support both Ethernet and RS232 to ensure compatibility with old and new machines.
For machines with limited data access, we use proven sensor-based methods that deliver 98 per cent accuracy in part count and cycle time. Our platform automatically normalises data across brands such as Fanuc, Siemens, Haas, and Mitsubishi. This creates consistent reporting even in mixed machine environments.
Real example:
A Gujarat-based auto components manufacturer reduced unplanned downtime by 18 per cent within the first 60 days because we identified recurring alarm 414 patterns during the installation audit.
Learn more about our approach and see how it works in your factory.
Frequently Asked Questions About CNC Machine Monitoring Installation
How much network bandwidth is required for CNC monitoring
CNC monitoring requires very low bandwidth. A single machine typically uses 20 to 40 KB per minute. Even a basic internal LAN can support 20 to 50 machines easily. What matters more is stable connectivity rather than high bandwidth.
Do older CNC machines support monitoring?
Yes. Machines without Ethernet or MTConnect can still be monitored using RS232 converters or smart sensors. Older Fanuc and Mitsubishi machines often require serial connectors or current sensors.
What if my machine does not provide part count data
You can still collect part count through cycle detection sensors or current signature patterns. Edge devices can identify cycle start and cycle complete signals accurately.
Is WiFi acceptable for CNC monitoring
It can work, but wired connections are always preferred. WiFi is suitable only when cable routing is impossible. WiFi interference from welding or heavy motors may affect accuracy.
How long does installation take
Simple machines with Ethernet take 30 to 60 minutes per machine. Older machines with RS232 or sensor-based solutions may take 2 to 3 hours per machine.
Can monitoring integrate with ERP or MES
Yes, most systems support APIs for automatic part count submission, downtime codes, and production scheduling. Integration requires collaboration with your ERP vendor.
What if operators forget to enter downtime reasons
Monitoring software can enforce mandatory reason codes before a machine is restarted. Supervisors can review missing entries during shift changes.
Is cloud storage safe for machine data?
Yes, if encrypted and aligned with IT policies. Many manufacturers prefer the cloud for easier multi-plant visibility. On-premises is ideal if your IT team wants full control.
Does monitoring affect machine performance?
No. Data is read passively from the controller or sensors. It does not interfere with machining programs or speed.
Can I monitor tool life using this system?
Indirectly yes. Spindle load, cycle time variations, and alarm patterns help estimate tool health. Some controllers also provide wear compensation data.
Conclusion
Installing CNC Machine Monitoring Software is not just a technical project. It is a step toward a data-driven manufacturing culture. When manufacturers understand machine-level terms, network requirements, software capabilities, and security considerations, the entire process becomes smoother and more accurate. With the right preparation, you gain real-time visibility, improve OEE, reduce downtime, and make confident decisions based on reliable data. The key is to invest time in understanding your machines before digital integration begins.