Most factory owners know something is wrong before they can prove it. Machines run a little slower than usual. Piles of rejects accumulate at the end of a shift. A machine breaks down, and no one saw it coming. These are not random events. They are warning signs.
The problem is that without real-time data, these signs are easy to miss or explain away. And every day you miss them, you are losing money.
This article walks you through 7 clear warning signs that your factory needs machine monitoring software right now. If even two or three of these signs sound familiar, your production floor is almost certainly leaving money on the table.
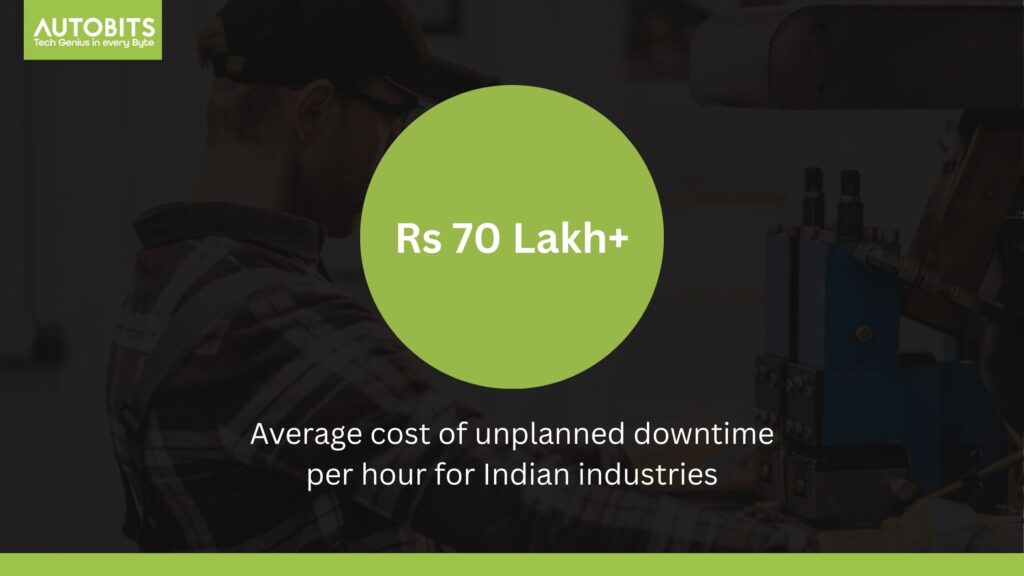
That is the cost every time a machine stops unexpectedly. For most Indian factories, this happens at least once a month.
Sign 1: You Do Not Know How Long Your Machines Were Actually Running Today
At the end of the day, can you tell exactly how many hours each machine ran? Not an estimate. Not what the operator wrote on a paper form. The actual number.
Most factories rely on shift registers or verbal reports to track machine uptime. Both methods are unreliable. Operators are busy. Handwriting is rushed. Estimates drift from reality.
When you do not know the real machine utilisation, you cannot improve it. You set production targets based on guesswork. You make decisions based on what your team tells you, not what actually happened.
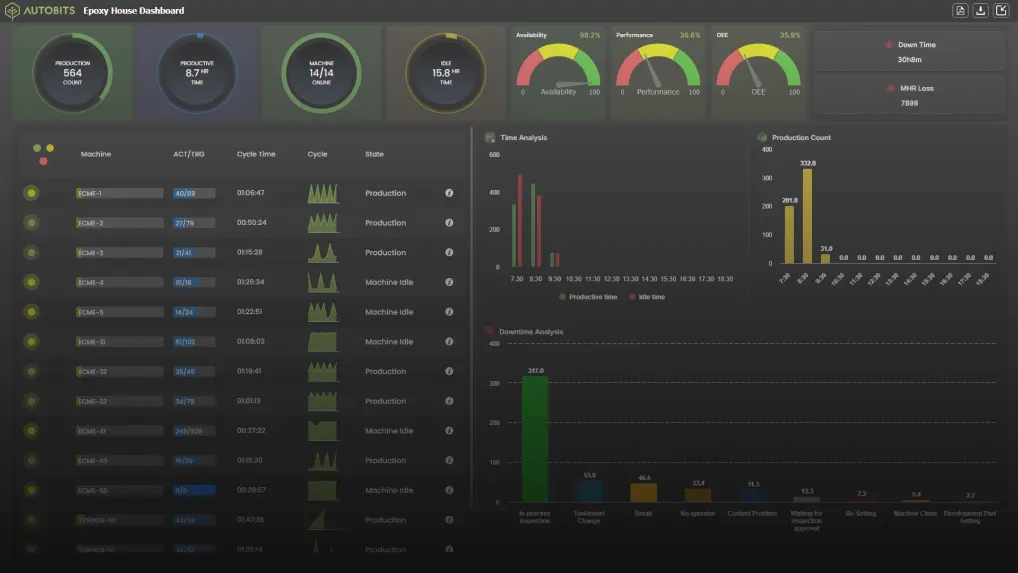
Machine monitoring software automatically tracks every second of runtime. There is no manual entry, no estimation, and no room for error. If you are still relying on paper registers or Excel to track machine hours, this is your first warning sign. You can see what a real-time view looks like on our CNC machine monitoring solution.
Sign 2: Your OEE Score Is Either Unknown or Below 60 Per cent
OEE stands for Overall Equipment Effectiveness. It measures how much of your planned production time is truly productive. A score of 100% means your machines ran at full speed, with zero stops, and produced zero rejects. In the real world, that never happens.
According to a benchmark analysis by Evocon covering more than 3,500 machines across 50 countries, the average OEE for manufacturers sits between 55% and 60%. World-class OEE is considered 85% or above. Only around 3% of manufacturers achieve that.
If you do not know your OEE score, that is itself a warning sign. If you do know it and it is below 55%, that means more than 45% of your production time is being lost to downtime, speed losses, or quality rejects. That is a serious problem.
Not sure how to calculate OEE? Read our guide on the 5 best free OEE calculators for manufacturing to get started with measuring it today.
Sign 3: Breakdowns Keep Surprising You
A machine stops. Everyone scrambles. Production halts. The maintenance team runs over. An engineer is called. Two hours later, everything is running again, and no one really knows why it broke down.
If this scenario feels familiar, your factory is operating in reactive mode. You are fixing problems after they happen instead of preventing them before they do.
According to the Siemens True Cost of Downtime 2024 report, the average manufacturing plant still experiences 25 downtime incidents per month. That is more than six stoppages every week. For most of these plants, the breakdown was not truly unexpected. The data existed. It just was not being watched.
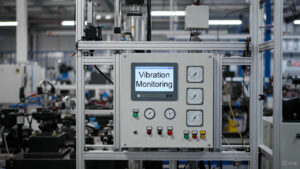
Machine monitoring systems track vibration, temperature, current draw, and other machine health signals continuously. When something starts drifting out of range, the system alerts your maintenance team before the machine stops. That changes everything.
Sign 4: Your Shift Reports Are Based on Memory, Not Data
Think about how your shift report gets written. An operator fills out a form at the end of the shift. They write down what they remember. They estimate how long the machine was down. They describe the reason in one or two words.
This process produces inaccurate data by design. Memory is unreliable. Estimates are optimistic. Important details get left out.
When managers make decisions based on these reports, they are making decisions based on fiction. They increase a machine’s production target because the report said the machine was running well. In reality, it stopped three times for 20 minutes each.
Machine monitoring captures every event automatically at the exact time it happens. Downtime is logged with a timestamp. Reasons can be entered directly on a tablet at the machine in real time, not reconstructed from memory an hour later.
Sign 5: You Cannot Tell Which Machine Is Causing the Most Production Loss
You have ten machines. You know production is lower than it should be. But you do not know which machine is the main culprit. Is it machine number 4 that has been making a grinding noise? Or machine number 7 that goes through tools quickly?
Without monitoring data, every maintenance decision is based on the loudest complaint, not the biggest actual impact. You fix the squeaky wheel, not the root cause.
A machine monitoring dashboard shows you every machine’s performance side by side in real time. You can see at a glance which machines have the most downtime, the lowest utilisation, or the worst quality output. You stop guessing and start targeting the real problems.
This is sometimes called discovering the hidden factory. The production capacity your existing machines already have, which is currently going to waste, is invisible and unmeasured.
KEY INSIGHT
Research consistently shows that the average machine utilisation rate is far lower than manufacturers expect. Most factories believe their machines are running at 70 to 80% capacity. Monitoring data typically reveals the actual figure is closer to 50 to 60%.
Sign 6: Quality Rejects Are Going Up, and You Cannot Find the Root Cause
A batch comes out with surface finish problems. Another batch has dimensional rejects. Your quality team writes it up as operator error or material variation. But the problems keep coming back.
Quality issues in manufacturing are almost always connected to machine behaviour. A spindle running slightly too fast. A tool that has gone past its useful life. A machine that runs differently in the first hour of a shift because it has not warmed up. These are machine data events, not random accidents.
When machine parameters are tracked alongside quality outcomes, you can correlate exactly which machine conditions lead to which quality problems. You stop treating rejects as inevitable and start treating them as preventable.
If your CNC machines are involved, the type of controller they use also affects how monitoring data is collected. Our article on CNC controller brands compared explains how different controllers communicate data and what that means for your monitoring setup.
Sign 7: You Are Making Capacity and Investment Decisions Without Production Data
You are thinking about buying a new machine. Or adding a night shift. Or taking on a large new order. How are you deciding?
If the answer is gut feel, experience, and a rough estimate from your production manager, you are making a major financial decision without the information you need. You might be about to spend Rs 50 lakhs on a new machine when your existing machines are only running at 55% capacity.
This happens in factories every day. Owners buy equipment to solve a capacity problem they do not actually have. The real problem is utilisation. Fix that first.
Machine monitoring data gives you the evidence you need to make good decisions. Before you invest in new equipment, you know exactly how much capacity your current machines have, where the losses are, and whether a process change or a maintenance improvement could solve the problem at a fraction of the cost.
Quick Reference: The 7 Warning Signs at a Glance
| # | Warning Sign | What It Means | Root Cause | Urgency |
| 1 | You do not know actual machine run time today | Flying blind on utilisation | No real-time data capture | High |
| 2 | OEE is unknown or below 60% | 45%+ of production time is being lost | No OEE measurement system | High |
| 3 | Breakdowns keep surprising you | Running in fully reactive maintenance mode | No machine health monitoring | High |
| 4 | Shift reports are based on memory | Decisions made on inaccurate data | Manual, paper-based reporting | High |
| 5 | Cannot identify which machine causes most loss | Fixing symptoms, not root causes | No multi-machine comparison | Medium |
| 6 | Quality rejects rising, root cause unknown | Machine parameters disconnected from quality | No parameter-to-quality link | High |
| 7 | Capacity decisions made without production data | Risk of costly, unnecessary investment | No verified utilisation data | Medium |
How Many of These Signs Does Your Factory Have?
If you recognise one or two of the signs above, it is worth exploring machine monitoring. If you recognise four or more, your factory is almost certainly losing a significant amount of production value every month without knowing it.
The good news is that you do not need to fix everything at once. Most factories start by connecting three to five of their most important machines. Within the first 30 days, you will have your first real OEE number and your first clear picture of where production time is actually going.
A USEFUL CONTEXT
According to the ABB Value of Reliability report (Sapio Research, 2023), 88% of Indian industrial businesses experience unplanned downtime at least once a month, and 19% still rely entirely on run-to-fail maintenance with no monitoring in place at all. If your factory is in that 19%, the warning signs above are almost certainly all present.
Frequently Asked Questions
What is machine monitoring, and how does it work?
Machine monitoring is a system that uses sensors and software to track what your machines are doing in real time. Sensors attached to each machine collect data such as whether the machine is running or stopped, how fast it is running, how much energy it is using, and how many parts it has produced. This data is sent to a cloud platform that turns it into dashboards, reports, and alerts that your team can see on any device.
How do I know if my factory actually needs machine monitoring software?
If you cannot accurately answer these three questions right now, you need machine monitoring: How many hours did each of your machines run today? What was the single biggest cause of production loss this week? What is your current OEE score? If the honest answer to any of these is I do not know, monitoring software will immediately give you that visibility.
Does machine monitoring only work on new or advanced CNC machines?
No. Machine monitoring can be set up on machines of almost any age or type, including older conventional lathes, VMCs, HMCs, presses, and injection moulding machines. Sensors connect to existing machine signals or motor circuits without requiring any modification to the machine itself. Most Indian MSME factories have a mix of old and new equipment, and monitoring systems are designed to handle that.
How quickly will I see results after installing machine monitoring?
Most factories see their first useful insight within the first two weeks. That is usually the discovery of a recurring downtime pattern or an idle-machine period that no one knew existed. Measurable improvements in OEE and downtime reduction typically appear within 60 to 90 days as the team starts acting on the data. Financial ROI is usually achieved within 6 to 12 months.
Is machine monitoring worth it for a small factory with only 5 or 10 machines?
Yes, often more so than for larger factories. With a small number of machines, every hour of downtime has a bigger relative impact on total output. The cost of a monitoring system for 5 to 10 machines is well within reach for most Indian MSMEs, and the payback period is typically shorter because each machine matters more to the overall production number.
Will my operators and supervisors actually use a machine monitoring dashboard?
This depends on how the system is set up. The best implementations keep the initial dashboard simple, showing three to four clear metrics that supervisors already care about. When the first dashboard is based on what operators and supervisors actually need to know, adoption happens naturally. Systems that overwhelm users with 20 metrics from day one tend to struggle with adoption.
What is the difference between machine monitoring and predictive maintenance?
Machine monitoring is the foundation on which predictive maintenance is built. Machine monitoring tells you what is happening right now: is the machine running, how fast, and how efficiently. Predictive maintenance uses historical monitoring data to forecast when something is likely to fail in the future. You need machine monitoring in place first before you can add predictive capabilities. You can read more about our predictive maintenance solution here.
What Happens Next
If you recognised yourself in three or more of these warning signs, the next step is straightforward. You need to see what is actually happening on your factory floor, in real time, for every machine.
That is exactly what machine monitoring software gives you. Not estimates. Not shift reports written from memory. Actual data, from every machine, every minute of every shift.
Autobits Labs works with manufacturers across India to set up machine monitoring systems that are practical, affordable, and ready to use within days. If you want to understand what is happening on your shop floor, you can explore the Factory Metrics IIoT Platform or book a free factory consultation at autobitslabs.com/contact-us.

Related Reading
- Strategies to Improve OEE in Your Factory: Read the full guide
- Factory Automation Explained: How Smart Manufacturing Works: Read the guide
- CNC Machine Vibration Monitoring: A Guide to Preventing Breakdowns: Read the guide
- What to Know Before Installing CNC Machine Monitoring Software: Read the checklist
- 5 Best Free OEE Calculators for Manufacturing: Read the roundup